The pi cycle bottom has flashed. The goal of this recently-created indicator is to try to estimate the macro bottom of the Bitcoin price. So, are we approaching the end of the bear market?
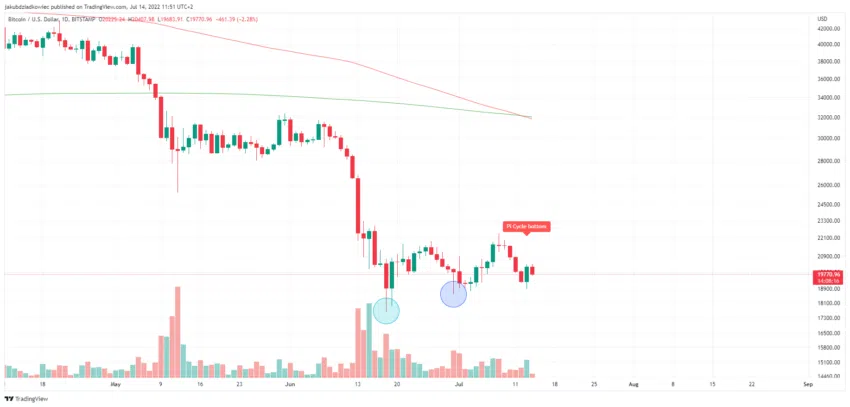
At the end of last month, Be[In]Crypto presented an analysis, according to which the pi cycle bottom indicator was supposed to flash on July 9. However, this happened on July 13, when BTC fell to the $18,900 level.
However, a lower low at $17,622 was recorded on June 18 (blue circle). Moreover, another low occurred as recently as June 30 at $18,600 (dark blue circle). Therefore, Wednesday’s low is the third consecutive higher low on the BTC chart, and it was only at this level that the pi cycle bottom flashed.

Historical performance of pi cycle bottom
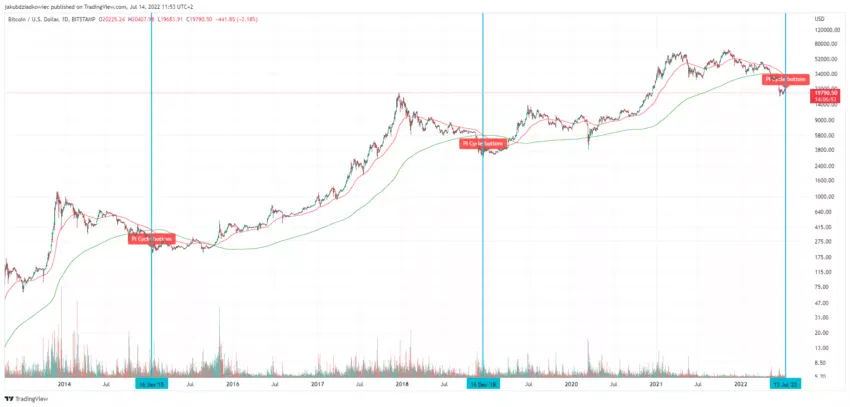
The pi cycle bottom is a simple indicator that is based on two long-term moving averages: 471-day SMA and 150-day EMA. The signal lights up when the latter falls below the former.
Historical analysis shows that so far such a crossing has happened three times in the history of BTC trading (blue line). The first time was on Jan 16 2015, just two days after the absolute bottom of the BTC price at $152.
The second time was on Dec 16 2018. This was a day after the absolute bottom of the previous bear market at $3,122. The third intersection occurred on Wednesday.

Compared to the two previous intersections, yesterday’s signal is heavily delayed. If the macro bottom was reached on June 18, the signal is 25 days late.
If, on the other hand, it shows similar accuracy to the previous two historical lows, we can expect a sharp capitulation on the BTC chart in the next two to three days.
